![]()
![]()
![]()
![]()
![]()
|
Thomas Bacquart, Ph.D. / Université de Bordeaux 1 Kelly Bradshaw / Vermont Department of Health Jeffrey Defelice / Norwich University Seth H. Frisbie, Ph.D. / Norwich University and Better Life Laboratories, Inc. Erika J. Mitchell, Ph.D. / Norwich University and Better Life Laboratories, Inc. George Springston / Norwich University Bibudhendra Sarkar, Ph.D. / University of Toronto and The Hospital for Sick Children Presented at the Fifth International Conference on Metals and Genetics in Kobe, Japan, 2011. |
 |
Around 150 million people are at risk from arsenic-contaminated groundwater in India and Bangladesh. Multi-metal analysis has found other toxic elements above the World Health Organization (WHO) drinking water guidelines which significantly increases the number of people at risk due to drinking groundwater. In this study, drinking water samples from the Bongaon area (North 24 Parganas district, West Bengal, India) were analyzed for multi-metal contamination in order to evaluate groundwater quality on the neighborhood scale. To the extent possible, the sampled tubewells were distributed at 500-meter (m) intervals along perpendicular axes that radiated in 4 equal lengths from the center for a total of 16 samples. Each sample was analyzed for arsenic (As), boron (B), barium (Ba), chromium (Cr), manganese (Mn), molybdenum (Mo), nickel (Ni), lead (Pb), and uranium (U). As, Mn and B were found above WHO health-based drinking water guidelines in 50%, 19% and 6% of these tubewells, respectively. Conversely, Ba, Cr, Mo, Ni, Pb, and U were not found above these WHO guidelines. The maps of As, Mn, and B concentrations show that approximately 75% of this area has no safe tubewells. Moreover, the concentrations of As, Mn, B, and many other toxic elements are independent of each other. Therefore, this widespread presence and independent distribution of other metals besides As must be taken into consideration for drinking water remediation strategies involving well switching or home-scale water treatment.
In India and Bangladesh, around 150 million people are at risk from As-contaminated groundwater1. However, As is not the only toxic metal of concern in the region; concentrations of B, Ba, Cr, Mn, Mo, Ni, Pb, and U have been found above WHO health-based guidelines in tubewells from nearby Bangladesh2. A recent study approximately 100 kilometers (km) away in Bangladesh shows that even if a tubewell has safe levels of As, it may have unsafe levels of Mn, U or others metals3. Although the hydrogeology of Bangladesh and West Bengal, India are similar, no systematic multimetal analysis of groundwater has been carried out in West Bengal to date.
In this study, groundwater samples from tubewells were collected from Bongaon neighborhood in West Bengal, India where the concentration of As is known to vary widely from tubewell to tubewell. The samples were analyzed for As, B, Ba, Cr, Mn, Mo, Ni, Pb, and U. These data were compared to satellite images (Google Maps) and element contour maps were drawn to identify potential areas of unsafe groundwater and show the spatial correlations between trace element concentrations. The correlations between the concentrations of As and other elements are an important aspect of the study.
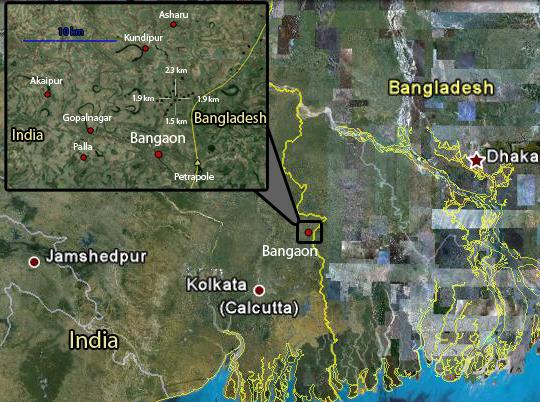
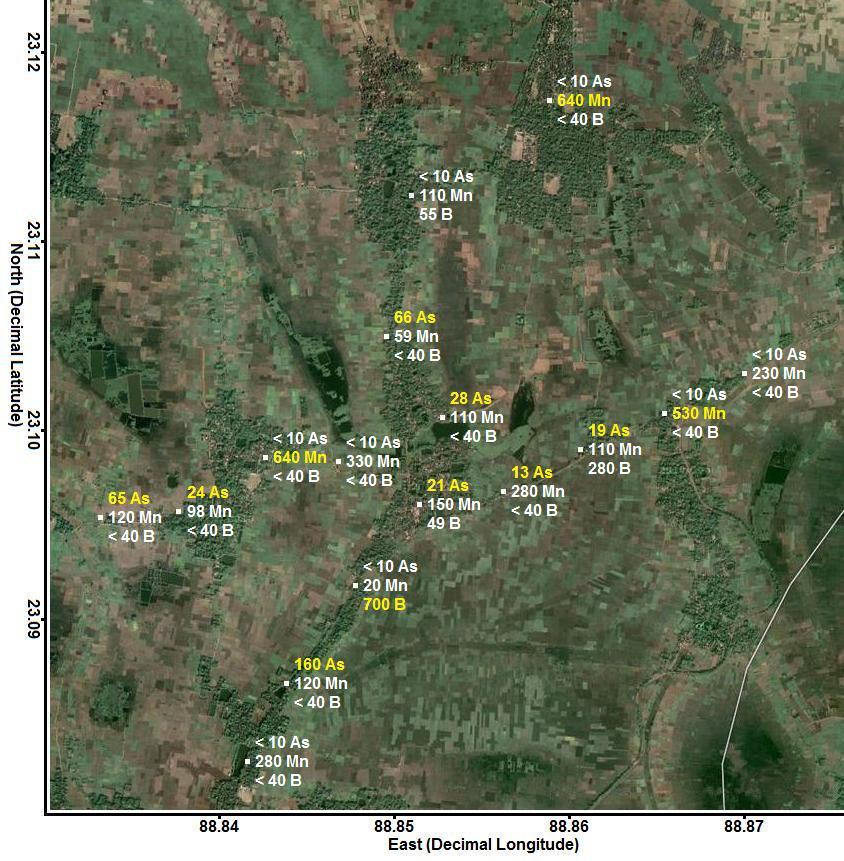
Sixteen systematic random samples of groundwater from tubewells were collected from Bongaon neighborhood area in North 24 Parganas district, West Bengal, India (Figure 1). To the extent possible, the sampled tubewells were distributed at 500-m intervals along perpendicular axes that radiated in 4 equal lengths from the center. The northings and eastings of these tubewells were measured using the Global Positioning System (GPS). Established collection, preservation, and storage methodologies were used to ensure that each sample was representative of groundwater quality3. These samples were analyzed for As, Ba, Cr, Mo, Pb and U by inductively coupled plasma mass spectroscopy (ICP-MS) and for B, Mn and Ni by colorimetry. A satellite image and 3 contour maps showing the concentrations of As, B, Mn were drawn using Google Maps and ArcGIS™ Version 9.1 (Figures 2, 3, 4, and 5).
 |
Quality control of laboratory analyses was assessed using externally supplied standards, known additions of standard to samples, and duplicate analyses of samples4.
The quality control results for this study are summarized in Table 1.
| Analyte | Analytical Method |
Detection Limit (μg/L) |
Recovery of Externally Supplied Standards (%) |
Recovery of Known Additions of Standard to Samples (%) a |
Precision of Samples (μg/L) |
| As | ICP-MS | 10 | 97 (Pass b) & 100 (Pass) | 117 ± 5 (High) | 0.03 |
| B | Colorimetry | 40 | 100 ± 55 a (Pass) | 70 ± 27 (Low d) | 56 |
| Ba | ICP-MS | 1 | 120 (High c) & 113 (Pass) | 121 ± 8 (High) | 1 |
| Cr | ICP-MS | 10 | 100 (Pass) & 101 (Pass) | 116 ± 28 (Pass) | 0.8 |
| Mn | Colorimetry | 5 | 98 ± 6 a (Pass) | 97 ± 33 (Pass) | 29 |
| Mo | ICP-MS | 10 | 113 (Pass) & 108 (Pass) | 114 ± 15 (Pass) | 0.02 |
| Ni | Colorimetry | 5 | 109 (Pass) | 105 ± 41 (Pass) | 0.002 |
| Pb | ICP-MS | 1 | 111 (Pass) & 109 (Pass) | 108 ± 23 (Pass) | 0.02 |
| U | ICP-MS | 0.08 | na e | 97 ± 123 (Pass) | 0.008 |
a 95% confidence interval.
b Pass = the recovery of externally supplied standard, or the recovery of known additions of standard to samples has no significant bias.
c High = the recovery of externally supplied standard, or the recovery of known additions of standard to samples is greater than the accepted value or range.
d Low = the recovery of known additions of standard to samples is less than the accepted range.
e na = not analyzed.
Externally supplied standards were used to test the accuracy of the calibration standards (Table 1). Two different certified reference materials were used as externally supplied standards for As, Ba, Cr, Mo, and Pb. One certified reference material was used as an externally supplied standard for Ni. Certified reference materials were not readily available for B, Mn, and U; however, externally supplied standards were made from independent sources of B and Mn. An independent source of U was not readily available. Of all these analytes, only Ba gave a recovery outside its accepted range of concentration suggesting a bias for this element. This bias over predicts the true concentration of Ba by approximately 20% (120% - 100% = 20%), which is protective of public health. Despite this over prediction, no samples from this study exceeded the WHO health-based drinking water guideline for Ba.
The recoveries of known additions of standard to samples were used to test if the sample matrix interferes with accuracy (Table 1). These recoveries for As and Ba were statistically greater than 100%. These biases over predict the true concentrations of As by approximately 17% (117% - 100% = 17%) and Ba by approximately 21% (121% - 100% = 21%), which are protective of public health. This recovery for B was statistically less than 100%. These biases under predict the true concentration of B by approximately 30% (100% - 70% = 30%), which suggests the reported concentrations of B in this matrix are on average less than the true concentrations of B in this matrix.
The precision of samples are given in Table 1. It is a standard deviation measured from duplicate analyses of samples.
| Analyte | Average Concentration (μg/L) |
Range of Concentrations (μg/L) |
WHO Health-Based Drinking Water Guideline (μg/L) |
% of Unsafe Tubewells a |
| As | 26 | < 10 to 160 | 10 | 50 |
| B | 70 | < 40 to 700 | 300 b | 6 |
| Ba | 168 | 26 to 490 | 700 | 0 |
| Cr | < 10 | < 10 to < 10 | 50 | 0 |
| Mn | 240 | 20 to 640 | 400 | 19 |
| Mo | < 10 | < 10 to < 10 | 70 | 0 |
| Ni | < 5 | < 5 to 10 | 70 | 0 |
| Pb | < 1 | < 1 to 9 | 10 | 0 |
| U | 0.22 | < 0.08 to 1.5 | 2 c | 0 |
a Seventy-five percent (12 out of 16) of these tubewells are unsafe. That is, only 25% (4 out of 16) of these tubewells do not exceed any of these WHO health-based drinking water guidelines.
b The WHO issued a 300 and 500 μg/L health-based and treatment-based drinking water guideline for boron, respectively5.
c Similarly, the WHO issued a 2 and 15 μg/L health-based and treatment-based drinking water guideline for uranium, respectively5.
All 16 groundwater samples from Bongaon were analyzed for every toxic element that has ever been found above WHO health-based guidelines in drinking water from neighboring Bangladesh: As, B, Ba, Cr, Mn, Mo, Ni, Pb, and U2-3. In this study, As, B, and Mn were found above WHO health-based drinking water guidelines. Conversely, Ba, Cr, Mo, Ni, Pb, and U were not found above these guidelines.
Chronic As poisoning is the most significant health risk caused by drinking water from this neighborhood. As concentrations ranged from < 10 μg/L to 160 μg/L, with 50% of tubewells above the 10 μg/L WHO drinking water guideline (Table 2; Figures 2 and 3)5. Drinking water with 10 μg/L of As has been associated with 3 extra deaths per 5,000 people from skin cancer6 and 10 extra deaths per 5,000 people from bladder, liver, or lung cancer7. In addition to these cancers, chronic As poisoning has been associated with melanosis, leukomelanosis, keratosis, hyperkeratosis, and nonpitting edema in Bangladesh8.
 |
 |
It is very important to realize that the 10-μg/L WHO drinking water guideline for As is based on a 6x10⁻⁴ excess lifetime skin cancer risk for human males, which is 60 times higher than the 1x10⁻⁵ factor that is typically used to protect public health6b. WHO states that the drinking water guideline for As should be 0.17 μg/L based on the risk of death from skin cancer. However, the detection limit for most laboratories is 10 μg/L, which is why the less protective guideline was adopted. "Guideline values are not set at concentrations lower than the detection limit achievable under routine laboratory operating conditions9."
Mn concentrations ranged from 20 μg/L to 640 μg/L, with 19% of tubewells above the 400 μg/L WHO health-based drinking water guideline (Table 2; Figured 2 and 4)5. Mn is a potent neurotoxin that causes Manganism, a condition characterized by hyperirritability, hallucinations, and Parkinson’s like tremors and balance problems in adults10 and learning disabilities in children11. It also causes liver and kidney damage, and increased infant mortality12. The WHO guideline for Mn in drinking water was calculated using the No Observed Adverse Effects Level (NOAEL) for neurological effects in humans and laboratory animals5a, 6b; recent research on neurological damage in children exposed to Mn in drinking water suggests that the calculated NOAEL levels are too high and may need significant revision11a.
 |
B concentrations ranged from < 40 μg/L to 700 μg/L, with 6% of tubewells above the 300 μg/L WHO health-based drinking water guideline (Table 2; Figures 2 and 5)5. This guideline is based on the NOAEL for testicular atrophy in a 2-year diet study of dogs6b.
 |
| As | B | Ba | Cr | Mn | Mo | Ni | Pb | U | |
| As | 1.00a | ||||||||
| B | -0.25 | 1.00a | |||||||
| Ba | 0.21 | -0.29 | 1.00a | ||||||
| Cr | -0.49 | 0.56b | -0.51b | 1.00a | |||||
| Mn | -0.38 | -0.32 | -0.06 | 0.32 | 1.00a | ||||
| Mo | 0.42 | 0.04 | 0.17 | -0.44 | -0.71a | 1.00a | |||
| Ni | 0.09 | 0.31 | -0.38 | 0.40 | -0.18 | 0.26 | 1.00a | ||
| Pb | -0.18 | -0.11 | -0.19 | 0.19 | 0.57b | -0.40 | -0.17 | 1.00a | |
| U | -0.29 | -0.16 | -0.27 | 0.29 | 0.56b | -0.62b | -0.08 | 0.73a | 1.00a |
In this sampling, no tubewell had more than 1 element above WHO health-based drinking water guidelines. That is, 8 tubewells had unsafe concentrations of As, 3 other tubewells had unsafe concentrations of Mn, and 1 other tubewell had unsafe concentrations of B. Therefore, 12 (8 + 3 + 1 = 12) out of 16 (75%) of these tubewells were unsafe and 4 out of 16 (25%) of these tubewells were safe (Table 1). No significant linear relationships between As, Mn, and B were found, suggesting that these elements are independently distributed (Table 2). Thus, tubewells that meet the WHO guideline for As cannot be assumed to provide safe water, since the water may still contain unsafe levels of Mn or B. This underscores the necessity for monitoring all toxic elements known to occur in groundwater in the region, not just As3.
The finding that multiple, independently distributed toxic elements besides As are present in the groundwater has several important implications for groundwater remediation (Table 2).
First, tubewell switching and water sharing is currently informed only on the basis of As results13. Switching to a well contaminated with other toxins such as Mn is likely to eventually bring about new health problems.
Second, simple home scale water treatment systems currently being used are designed to remove only As; their removal of other elements has not been tested extensively.
These two remediation strategies have a short term view; a long term solution must take into account all toxic elements that exceed WHO health-based drinking water guidelines. As was shown by Frisbie et al for Bangladesh3, this first multi-metal mapping study at the neighborhood scale in West Bengal emphasizes the fact that As is not the only element that must be monitored. Improving knowledge of multi-metal exposures may shed light on the discrepancies of health effects found in As-contaminated areas.
We thank the Kolkata Rescue NGO and Dr Tuhin Ghosh from Jadavpur University for their valuable assistance with this project.
![]()
![]()
![]()
![]()
![]()