In our study, groundwater concentrations of 30 analytes (Ag, Al, As, Ba, Bi, Ca, Cd, Co, Cr, Cs, Cu, F-, Fe, H+, K, Mg, Mn, Mo, Ni, Pb, Rb, S, Sb, Si, Se, Sr, Tl, V, W, and Zn) were mapped on a national scale (Figure 1). These maps are the first national-scale surveys of 28 of these analytes (Ag, Al, Ba, Bi, Ca, Cd, Co, Cr, Cs, Cu, F-, Fe, K, Mg, Mn, Mo, Ni, Pb, Rb, S, Sb, Si, Se, Sr, Tl, V, W, and Zn) in Bangladesh’s drinking water. These maps are preliminary because of their limited sample size; however, they identify several potentially significant public health challenges that require urgent attention and additional study.
A correlation coefficient matrix for pH, the concentrations of these analytes in groundwater, and tubewell depth are shown in Table 1 for informational purposes. The minimum, maximum, and average reported tubewell depths in our study were 7 m, 335 m, and 48 m, respectively. Silver (Ag) and bismuth (Bi) are not included in this table because these elements were never found above their respective 0.0002 mg/L and 0.0003 mg/L detection limits. The relatively poor correlation between As and total S (r = -0.08; Table 1) supports the 1997 hypothesis that pyrites are not the principal source of As in Bangladesh’s groundwater (8,9). In addition, the relatively small and negative correlation between As and depth (r = -0.13; Table 1) supports the 1997 hypothesis that drilling deeper tubewells can access drinking water with significantly lower As concentrations approximately 20% of the time (10,11).
| pH | F- | Mg | Al | Si | S | K | Ca | V | Cr | Mn | Fe | Co | Ni | Cu | Zn | As | Se | Rb | Sr | Mo | Cd | Sb | Cs | Ba | W | Tl | Pb | Depth | |
| pH | 1.00 | ||||||||||||||||||||||||||||
| F- | 0.27 | 1.00 | |||||||||||||||||||||||||||
| Mg | 0.27 | -0.04 | 1.00 | ||||||||||||||||||||||||||
| Al | 0.11 | 0.20 | 0.10 | 1.00 | |||||||||||||||||||||||||
| Si | 0.11 | 0.20 | -0.04 | 0.23 | 1.00 | ||||||||||||||||||||||||
| S | 0.04 | 0.05 | 0.35 | 0.36 | -0.11 | 1.00 | |||||||||||||||||||||||
| K | 0.08 | -0.41 | 0.62 | 0.00 | -0.06 | 0.08 | 1.00 | ||||||||||||||||||||||
| Ca | 0.11 | 0.08 | 0.61 | 0.09 | -0.23 | 0.18 | 0.10 | 1.00 | |||||||||||||||||||||
| V | 0.24 | 0.21 | 0.23 | 0.70 | 0.38 | 0.17 | 0.11 | -0.05 | 1.00 | ||||||||||||||||||||
| Cr | 0.16 | 0.18 | 0.15 | 0.89 | 0.24 | 0.19 | 0.02 | 0.13 | 0.75 | 1.00 | |||||||||||||||||||
| Mn | -0.01 | 0.28 | 0.20 | 0.07 | -0.05 | 0.29 | -0.19 | 0.27 | 0.02 | 0.01 | 1.00 | ||||||||||||||||||
| Fe | 0.05 | -0.10 | 0.31 | 0.46 | 0.03 | 0.47 | 0.08 | 0.38 | 0.16 | 0.39 | 0.20 | 1.00 | |||||||||||||||||
| Co | 0.04 | 0.24 | 0.05 | 0.72 | 0.24 | 0.19 | -0.11 | 0.04 | 0.64 | 0.68 | 0.27 | 0.24 | 1.00 | ||||||||||||||||
| Ni | 0.10 | 0.24 | -0.01 | 0.92 | 0.28 | 0.14 | -0.08 | -0.01 | 0.75 | 0.92 | 0.06 | 0.33 | 0.80 | 1.00 | |||||||||||||||
| Cu | 0.11 | 0.24 | 0.00 | 0.93 | 0.27 | 0.19 | -0.07 | 0.00 | 0.75 | 0.94 | 0.07 | 0.36 | 0.75 | 0.99 | 1.00 | ||||||||||||||
| Zn | 0.09 | -0.14 | 0.11 | 0.07 | -0.05 | -0.02 | 0.04 | 0.05 | -0.01 | 0.01 | -0.08 | 0.07 | 0.00 | 0.02 | 0.02 | 1.00 | |||||||||||||
| As | 0.20 | -0.23 | 0.46 | 0.11 | 0.03 | -0.08 | 0.53 | 0.37 | 0.00 | 0.09 | -0.13 | 0.25 | -0.03 | -0.02 | -0.02 | 0.17 | 1.00 | ||||||||||||
| Se | 0.15 | 0.09 | 0.26 | -0.05 | -0.11 | -0.07 | 0.15 | 0.01 | 0.22 | 0.03 | 0.06 | -0.09 | -0.10 | -0.03 | -0.03 | -0.02 | 0.06 | 1.00 | |||||||||||
| Rb | -0.12 | -0.27 | 0.19 | 0.18 | -0.08 | 0.28 | 0.53 | -0.06 | 0.02 | 0.10 | -0.09 | 0.40 | 0.04 | 0.08 | 0.10 | 0.03 | 0.25 | -0.02 | 1.00 | ||||||||||
| Sr | 0.18 | 0.06 | 0.83 | 0.12 | -0.08 | 0.23 | 0.37 | 0.83 | 0.07 | 0.15 | 0.25 | 0.40 | 0.10 | 0.00 | 0.00 | 0.07 | 0.48 | 0.14 | 0.10 | 1.00 | |||||||||
| Mo | 0.34 | 0.37 | 0.27 | 0.37 | 0.11 | 0.02 | 0.18 | 0.26 | 0.26 | 0.34 | 0.17 | 0.22 | 0.23 | 0.32 | 0.32 | 0.09 | 0.45 | 0.18 | 0.06 | 0.26 | 1.00 | ||||||||
| Cd | 0.11 | 0.02 | -0.01 | 0.37 | -0.01 | 0.04 | -0.02 | -0.05 | 0.40 | 0.46 | -0.04 | 0.11 | 0.58 | 0.51 | 0.48 | 0.07 | -0.02 | 0.02 | 0.11 | -0.01 | 0.07 | 1.00 | |||||||
| Sb | 0.08 | 0.18 | 0.03 | 0.88 | 0.17 | 0.40 | -0.01 | 0.00 | 0.68 | 0.86 | 0.10 | 0.42 | 0.71 | 0.90 | 0.93 | 0.00 | -0.05 | -0.07 | 0.21 | 0.01 | 0.29 | 0.48 | 1.00 | ||||||
| Cs | 0.23 | 0.00 | 0.10 | 0.60 | 0.19 | 0.36 | 0.30 | -0.11 | 0.48 | 0.55 | -0.07 | 0.38 | 0.44 | 0.54 | 0.56 | 0.05 | 0.18 | 0.04 | 0.54 | 0.06 | 0.23 | 0.34 | 0.65 | 1.00 | |||||
| Ba | 0.19 | 0.04 | 0.42 | 0.14 | -0.17 | 0.32 | 0.05 | 0.66 | -0.10 | 0.14 | 0.14 | 0.63 | 0.04 | 0.02 | 0.04 | 0.10 | 0.41 | -0.02 | 0.15 | 0.62 | 0.22 | 0.07 | 0.11 | 0.19 | 1.00 | ||||
| W | 0.07 | -0.09 | 0.04 | -0.02 | 0.05 | -0.04 | 0.20 | -0.09 | 0.05 | 0.03 | -0.26 | 0.02 | -0.11 | -0.06 | -0.05 | 0.04 | 0.26 | 0.30 | 0.08 | 0.00 | 0.04 | -0.05 | -0.07 | 0.19 | 0.03 | 1.00 | |||
| Tl | 0.17 | 0.01 | -0.09 | -0.07 | -0.03 | 0.08 | 0.07 | -0.25 | 0.06 | -0.07 | -0.14 | -0.17 | 0.21 | -0.01 | -0.05 | 0.00 | -0.13 | -0.01 | 0.15 | -0.17 | -0.06 | 0.49 | -0.01 | 0.21 | -0.08 | 0.16 | 1.00 | ||
| Pb | 0.34 | 0.24 | -0.06 | 0.67 | 0.21 | 0.04 | -0.04 | -0.17 | 0.66 | 0.67 | -0.15 | 0.18 | 0.54 | 0.72 | 0.72 | 0.08 | 0.01 | -0.02 | 0.07 | -0.09 | 0.22 | 0.45 | 0.65 | 0.53 | -0.03 | 0.04 | 0.07 | 1.00 | |
| Depth | 0.09 | 0.13 | -0.24 | -0.06 | 0.04 | -0.10 | -0.23 | -0.18 | -0.06 | -0.05 | -0.18 | -0.12 | -0.11 | -0.05 | -0.04 | 0.15 | -0.13 | 0.12 | -0.10 | -0.20 | -0.08 | -0.07 | -0.09 | 0.07 | -0.06 | 0.51 | 0.14 | 0.05 | 1.00 |
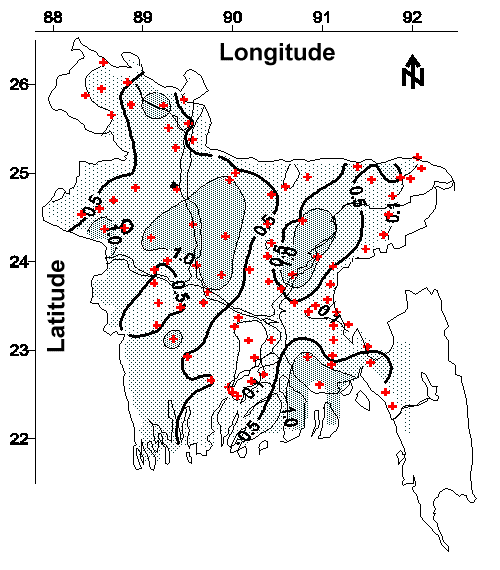
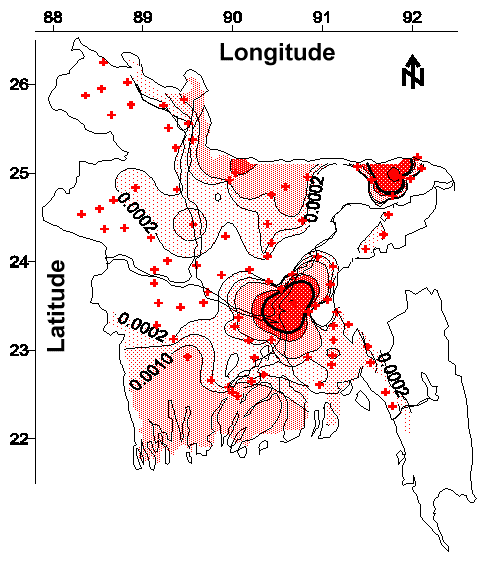
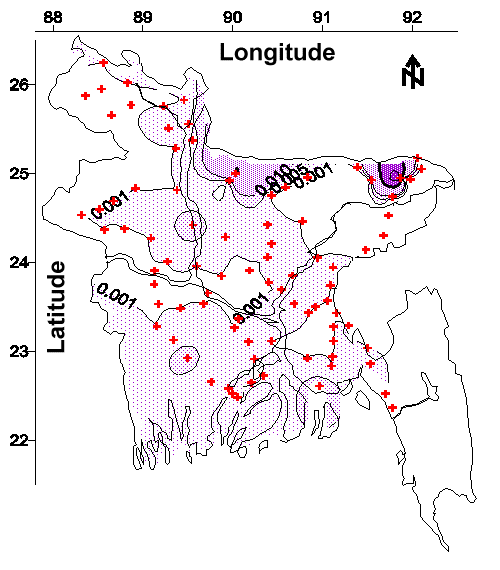
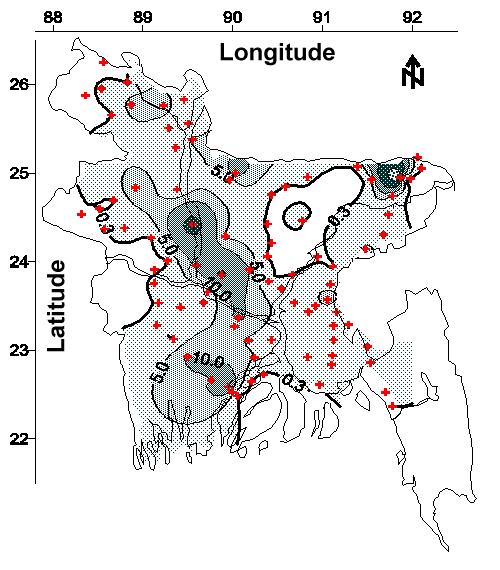
Of these analytes, the concentrations of As, manganese (Mn), lead (Pb), nickel (Ni), and chromium (Cr) exceeded WHO (5,6) or U.S. Environmental Protection Agency (U.S. EPA) (24,25) health-based drinking water criteria (Table 2). Maps showing the extent of As, Mn, Pb, Ni, and Cr in groundwater were drawn using kriging (Figures 2-6), a standard geostatistical technique (26).
| Element a | Risk-based Drinking Water Criteria (mg/L) |
Percent of Bangladesh’s Area Exceeding Criteria |
||
| WHO | U.S. EPA | WHO | U.S. EPA | |
| As Ba Cd Cr Cu F- Mn Mo Ni Pb Sb Se Tl |
0.010 0.700 0.003 0.050 2.000 1.500 0.500 0.070 0.020 0.010 0.005 0.010 None |
0.010 2.000 0.005 0.100 1.300 4.000 None None 0.100 0.015 0.006 0.050 0.002 |
49 0 0 < 1 0 0 50 0 < 1 3 0 0 NA |
49 0 0 0 0 0 NAb NA < 1 2 0 0 0 |
This map of As concentration (Figure 2) agrees with all three other national-scale surveys of randomly selected tubewells in Bangladesh (10,11,27,28). This agreement suggests that our national-scale maps of Mn, Pb, Ni, and Cr (Figures 3-6) are valid as well. Our map of As concentration (Figure 2) agrees with that produced by the 1997 USAID field program (10,11); however, the 1997 map was based on a 0.03 mg/L detection limit, which was not sensitive enough to delineate the WHO drinking water guideline. In contrast, Figure 2 allows delineation of the 0.01 mg/L WHO and 0.05 mg/L Bangladesh criteria for As in drinking water because the detection limit for As by ICP/MS was 0.0007 mg/L. Figure 2 indicates that approximately 49% of Bangladesh’s area contains groundwater with As concentrations greater than the WHO drinking water guideline. These results agree with the estimated 44% of Bangladesh’s area having unsafe levels of As reported by Karim et al. in 1997 (27). In addition, our results agree with an unreviewed national-scale study reported on the Internet by the British Geological Survey/Government of Bangladesh Department of Public Health Engineering (BGS/DPHE) team (28). The BGS/DPHE survey used kriging based on 3,534 samples to estimate that 57 million Bangladeshis are drinking water with As concentrations above the WHO drinking water guideline, a number similar to our survey estimate of 60 million.
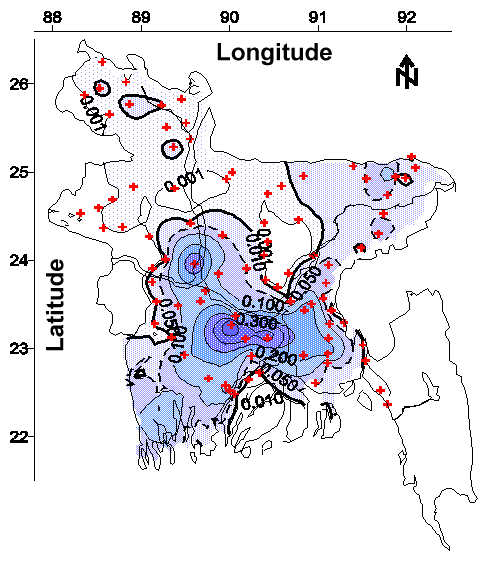 |
It is very important to recognize that the 0.01 mg/L WHO drinking water guideline for As is based on a 6 × 10⁻⁴ excess skin cancer risk for human males in Taiwan (29), which is 60 times higher than the 1 × 10⁻⁵ factor that is typically used to protect public health. WHO states that the health-based drinking water guideline for As should be 0.00017 mg/L. However, the detection limit for most laboratories is 0.01 mg/L, which is why the less protective guideline was adopted (5,6). There is sufficient evidence from human epidemiologic studies linking increased mortality from liver, kidney, bladder, and lung cancers to drinking As-contaminated water; however, this relatively new discovery is not used to calculate the drinking water standard for As due to a lack of dose-response data (30,31). Furthermore, a thorough review of As and public health recommends a zero exposure level for As in drinking water (31). In our study, the As concentration ranged from < 0.0007 to 0.64 mg/L. Arsenic was measured at or above its 0.0007 mg/L detection limit in 84% of the samples. Arsenic exceeded the 0.01 mg/L WHO drinking water guideline in 48% of the samples.
The most important finding of our national-scale study is that approximately 50% of Bangladesh’s area may contain groundwater with Mn concentrations greater than the WHO health-based drinking water guideline (5,6). Our study also indicates that Pb (3% of Bangladesh’s area), Ni (< 1% of Bangladesh’s area), and Cr (< 1% of Bangladesh’s area) concentrations exceed WHO health-based guidelines (5,6). These results are supported by the BGS/DPHE’s national-scale study based on between 20 and 3,530 samples (28), which suggests that 35%, < 1%, 0%, and 0% of Bangladesh’s tubewells exceed the WHO health-based drinking water guidelines for Mn, Pb, Ni, and Cr, respectively. In addition, the BGS/DPHE study suggests that 5.3%, 0.3%, and an unspecified percentage of Bangladesh’s tubewells exceed the WHO health-based drinking water guidelines for boron, barium, and molybdenum, respectively. Moreover, the BGS/DPHE study suggests that 12-50% of Bangladesh’s tubewells exceed the WHO health-based drinking water guideline for uranium.
 |
 |
 |
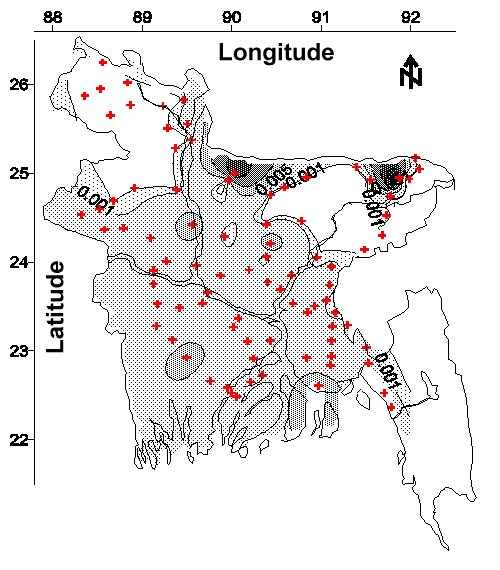 |
In our study, Mn exceeded the 0.5 mg/L WHO drinking water guideline in 37% of the samples. The maximum concentration of Mn was 2.0 mg/L. Despite the relatively poor -0.13 correlation coefficient between As and Mn (Table 1), 35% of the samples that exceeded the WHO drinking water guideline for As also exceeded the WHO drinking water guideline for Mn. The areas where the WHO drinking water guidelines were exceeded for both As and Mn can be estimated by superimposing Figures 2 and 3. Similarly, 2% of the samples that exceeded the WHO drinking water guideline for As also exceeded the WHO drinking water guideline for Pb (r = 0.01; Table 1). Likewise, 2% of the samples that exceeded the WHO drinking water guideline for As also exceeded the WHO drinking water guideline for Ni (r = -0.02; Table 1). Correspondingly, 2% of the samples that exceeded the WHO drinking water guideline for As also exceeded the WHO drinking water guideline for Cr (r = 0.09; Table 1). If a sample exceeded the WHO drinking water guideline for Ni, then the sample also exceeded the WHO drinking water guideline for Cr (r = 0.92; Table 1).
The above findings raise serious concerns relating to environmental health issues caused by multimetal effects. The As, Mn, Pb, Ni, and Cr in Bangladesh’s drinking water are associated with known health risks. Arsenic is classified as a "human carcinogen" based on sufficient epidemiologic evidence (30). Manganese is a known mutagen (32). The accumulation of Mn may cause hepatic encephalopathy (33). Moreover, the chronic ingestion of Mn in drinking water is associated with neurologic damage (34). The 0.5 mg/L WHO drinking water guideline for Mn was calculated using human exposures in Japan and Greece and studies of various laboratory animals where neurotoxic and other effects were observed (29). Lead is a "possible human carcinogen" because of inconclusive evidence of human and sufficient evidence of animal carcinogenicity (29). In addition, Pb also causes many noncarcinogenic disorders in humans (35). The 0.01 mg/L WHO drinking water guideline for Pb was calculated using the lowest measurable retention of Pb in the blood and tissues of human infants (29). Nickel is a "probable human carcinogen" (36). The 0.02 mg/L WHO drinking water guideline for Ni was calculated using no observed adverse effects level (NOAEL) and lowest observed adverse effects level (LOAEL) in studies of laboratory rats (37). The International Agency for Research on Cancer categorizes Cr(VI) as "carcinogenic to humans" and Cr(III) as "not classifiable" (38); however, the U.S. EPA lists total Cr in drinking water as having "inadequate or no human and animal evidence of carcinogenicity" (24). The WHO states that 0.05 mg/L drinking water guideline for total Cr is unlikely to cause significant health risks (29).
Figures 2-6 also suggest that groundwater with unsafe levels of As, Mn, Pb, Ni, and Cr extend beyond Bangladesh’s borders into the four adjacent and densely populated Indian states of West Bengal, Assam, Meghalaya, and Tripura. West Bengal has over two million Indians drinking from tubewells with unsafe levels of As and 200,000 suffering from chronic As poisoning (39); however, we are unaware of any systematic survey of other toxins in West Bengal’s groundwater. We are also unaware of any systematic survey of tubewell water quality in Assam, Meghalaya, or Tripura. Prudence suggests that the 11-year delay between the discovery of chronic As poisoning from groundwater in West Bengal and neighboring Bangladesh should not be repeated (40). Therefore, the groundwater used for drinking in the adjacent and densely populated Indian states of West Bengal, Assam, Meghalaya, and Tripura should be immediately tested to determine if it is safe.
The severity of chronic As poisoning in Bangladesh might be magnified by exposure to Sb. Antimony in drinking water has been reported to modulate the toxicity of As (16). Antimony was measured at or above its 0.0015 µg/L detection limit in 98% of the samples from this study. Arsenic was measured at or above its 0.7 µg/L detection limit in 84% of the samples from this study. Despite the relatively poor -0.05 correlation coefficient between As and Sb (Table 1), 97% of the samples with detectable concentrations of As had detectable concentrations of Sb. The concentration of Sb ranged from 0.0015 to 1.8 µg/L and did not exceed its 5 µg/L WHO health-based drinking water guideline. However, this guideline is based on the toxicity of exclusively ingesting Sb, not the influence of Sb on chronic As poisoning. The 5 µg/L WHO drinking water guideline for Sb was calculated using the LOAEL for decreased longevity, altered blood glucose levels, and altered blood cholesterol levels in laboratory rats (29). It is possible that these otherwise safe levels of Sb may cause a magnification of As toxicity. Humic substances might also magnify As toxicity (18) and were measured at relatively high concentrations in tubewells from Faridpur, one of Bangladesh’s most severely affected districts (41).
The WHO and U.S. EPA have not established health-based drinking water guidelines for Fe; however, approximately 69% of Bangladesh’s area may exceed the WHO and U.S. EPA’s 0.3 mg/L secondary criteria (24,25) (Figure 7). In addition, As and Fe have a positive 0.25 correlation coefficient (Table 1). Moreover, the As contaminated water has relatively high Fe concentrations; for example, drinking water samples exceeding 0.05 mg/L As have an average of 8.0 mg/L Fe. The potential health effects of these high Fe concentrations on chronic As poisoning are unknown. However, there are reports suggesting high body Fe stores and dietary intakes of Fe are associated with hepatocellular carcinoma in humans (42) and mammary carcinogenesis in female Sprague-Dawley rats (43). In addition, As causes the release of Fe from ferritin, the generation of activated oxygen species, and DNA damage (44).
 |
In contrast, Se is an essential element that prevents the cytotoxic effects of As (17). Se was not found above its 3 µg/L detection limit in 93% of the drinking water samples from this study. Significantly, 92% of the samples with detectable concentrations of As did not have detectable concentrations of Se. This general absence of Se and presence of As in drinking water is supported by the relatively poor 0.06 correlation coefficient for these elements (Table 1). The maximum concentration of Se was 5.4 µg/L. Additionally, Zn is an essential element that promotes the repair of tissues damaged by As (18). Zinc was not found above its 0.7 µg/L detection limit in 21% of the drinking water samples from this study. Importantly, 18% of the samples with detectable concentrations of As did not have detectable concentrations of Zn (r = 0.17; Table 1). If the sample did not have a detectable concentration of Zn, then the sample did not have a detectable concentration of Se (r = -0.02; Table 1). Furthermore, Bangladesh’s agricultural soils might be Se deficient and are often Zn deficient (45); therefore, it is possible that the apparent absence of these essential nutritive elements in drinking water and possibly food may cause a magnification of As toxicity.